

Google Forms
Forms lets users build surveys and collect responses in real time. Forms’ surveys are responsive, which means they adjust and look sharp on smartphones or desktop computer screens. Question options include multiple choice, linear scale and open-ended, among others.[5]
For a free tool, Google Forms is robust and easy to use. Here’s how to put this data-collection workhorse to work for you:[6], [7]
- Create a database: Forms can be used to make a customer or prospect database by collecting email addresses for online communication, including e-newsletters and invitations.
- Launch a survey: Get feedback on any issue that affects your business, from product development to customer service. Forms offers logic branching, which displays different questions based on a respondent’s previous answers; responses conveniently export to a spreadsheet. The final analysis? Crunching numbers and discovering data trends is a snap.
Fusion Tables
Fusion Tables allows users to visualize data with interactive charts and maps, including network graphs, map charts, heat maps and more.[8], [9] Google pitches the tool as a way to “filter and summarize across hundreds of thousands of rows.” The tool is built for collaboration and allows real-time updates to data.[10] This tool is good for discovering patterns at a high level.
Fusion Tables breaks data out of the spreadsheet mold. Instead of staring at rows and columns, data come to life, and relationships are revealed on maps, network graphs and more:[11], [12]
-
- Map your data: Use this tool to mark physical addresses in a spreadsheet onto an interactive map. Fusion Tables also allows two sets of data to be merged. For example, your business locations could be mapped with competitor locations. This information could shape geography-specific promotions or assist in determining new location opportunities.
- Graph your data: Network graphs show data that are connected. Entities and their relationships are represented by circles and lines, respectively. Here’s a simple network graph example:
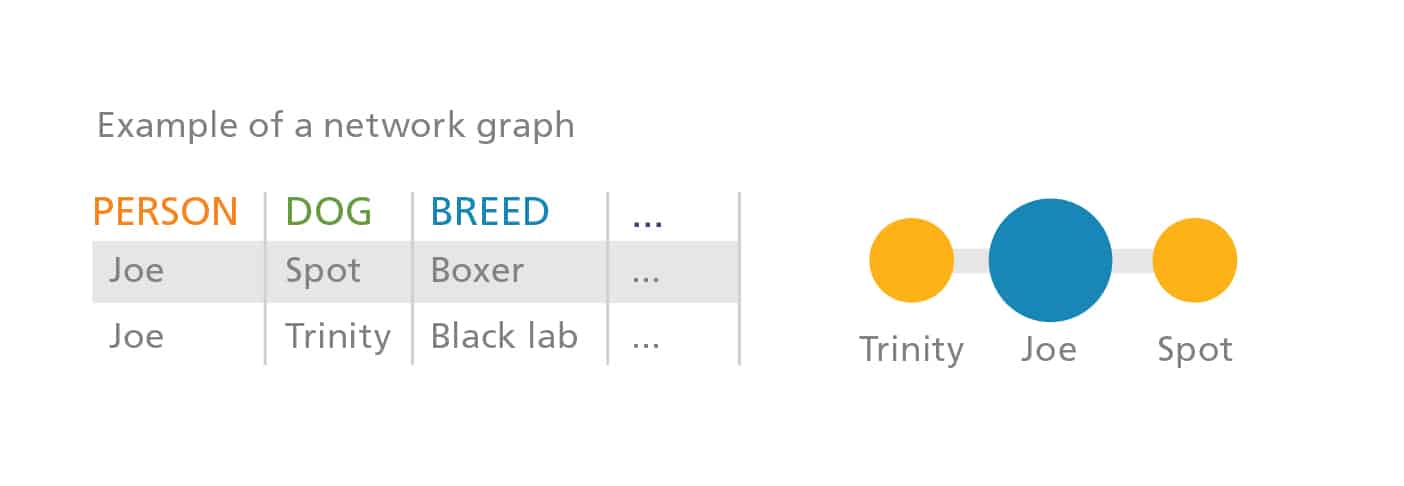
Figure 1: Network graph example[13]
Use a network graph to visualize your website’s backlinks, which are critical to search engine optimization. A high-level view of the domains that link to your pages could help you discover visitor traffic patterns and opportunities for calls to action.
Trends
Discover what’s being searched on Google with Trends. View the populace’s interest in a search term over time and segment results by location, time frame, category (e.g., business, entertainment) and search type (e.g., image search, news search, etc.).[14] Trends also highlights the hottest searches of the day and the most popular searches in different categories.[15], [16]
Google Trends is a powerful tool for vetting keywords and adding website content. But it also can be used for “offline” business activity:[17], [18]
- Create a calendar: Enter your key product and service offerings into Trends to see how interest in them changes throughout the year. If you know when interest traditionally peaks and bottoms out for your products, you can better plan marketing activity.
- Compare locations: Trends can take a search term and show its relative interest across different geographic locations. To leverage this feature, a business could examine regional interest in particular brands and products it sells and modify offerings and promotions accordingly.
Page 2 of 3